దస్త్రం:Changes in total solar irradiance and monthly sunspot numbers, 1975-2013.png
Jump to navigation
Jump to search
ఈ మునుజూపు పరిమాణం: 796 × 600 పిక్సెళ్ళు. ఇతర రిజల్యూషన్లు: 319 × 240 పిక్సెళ్ళు | 637 × 480 పిక్సెళ్ళు | 1,020 × 768 పిక్సెళ్ళు | 1,280 × 964 పిక్సెళ్ళు | 2,318 × 1,746 పిక్సెళ్ళు.
అసలు దస్త్రం (2,318 × 1,746 పిక్సెళ్ళు, ఫైలు పరిమాణం: 289 KB, MIME రకం: image/png)
This is a file from the Wikimedia Commons. Information from its description page there is shown below. Commons is a freely licensed media file repository. You can help. |
సారాంశం
| వివరణ |
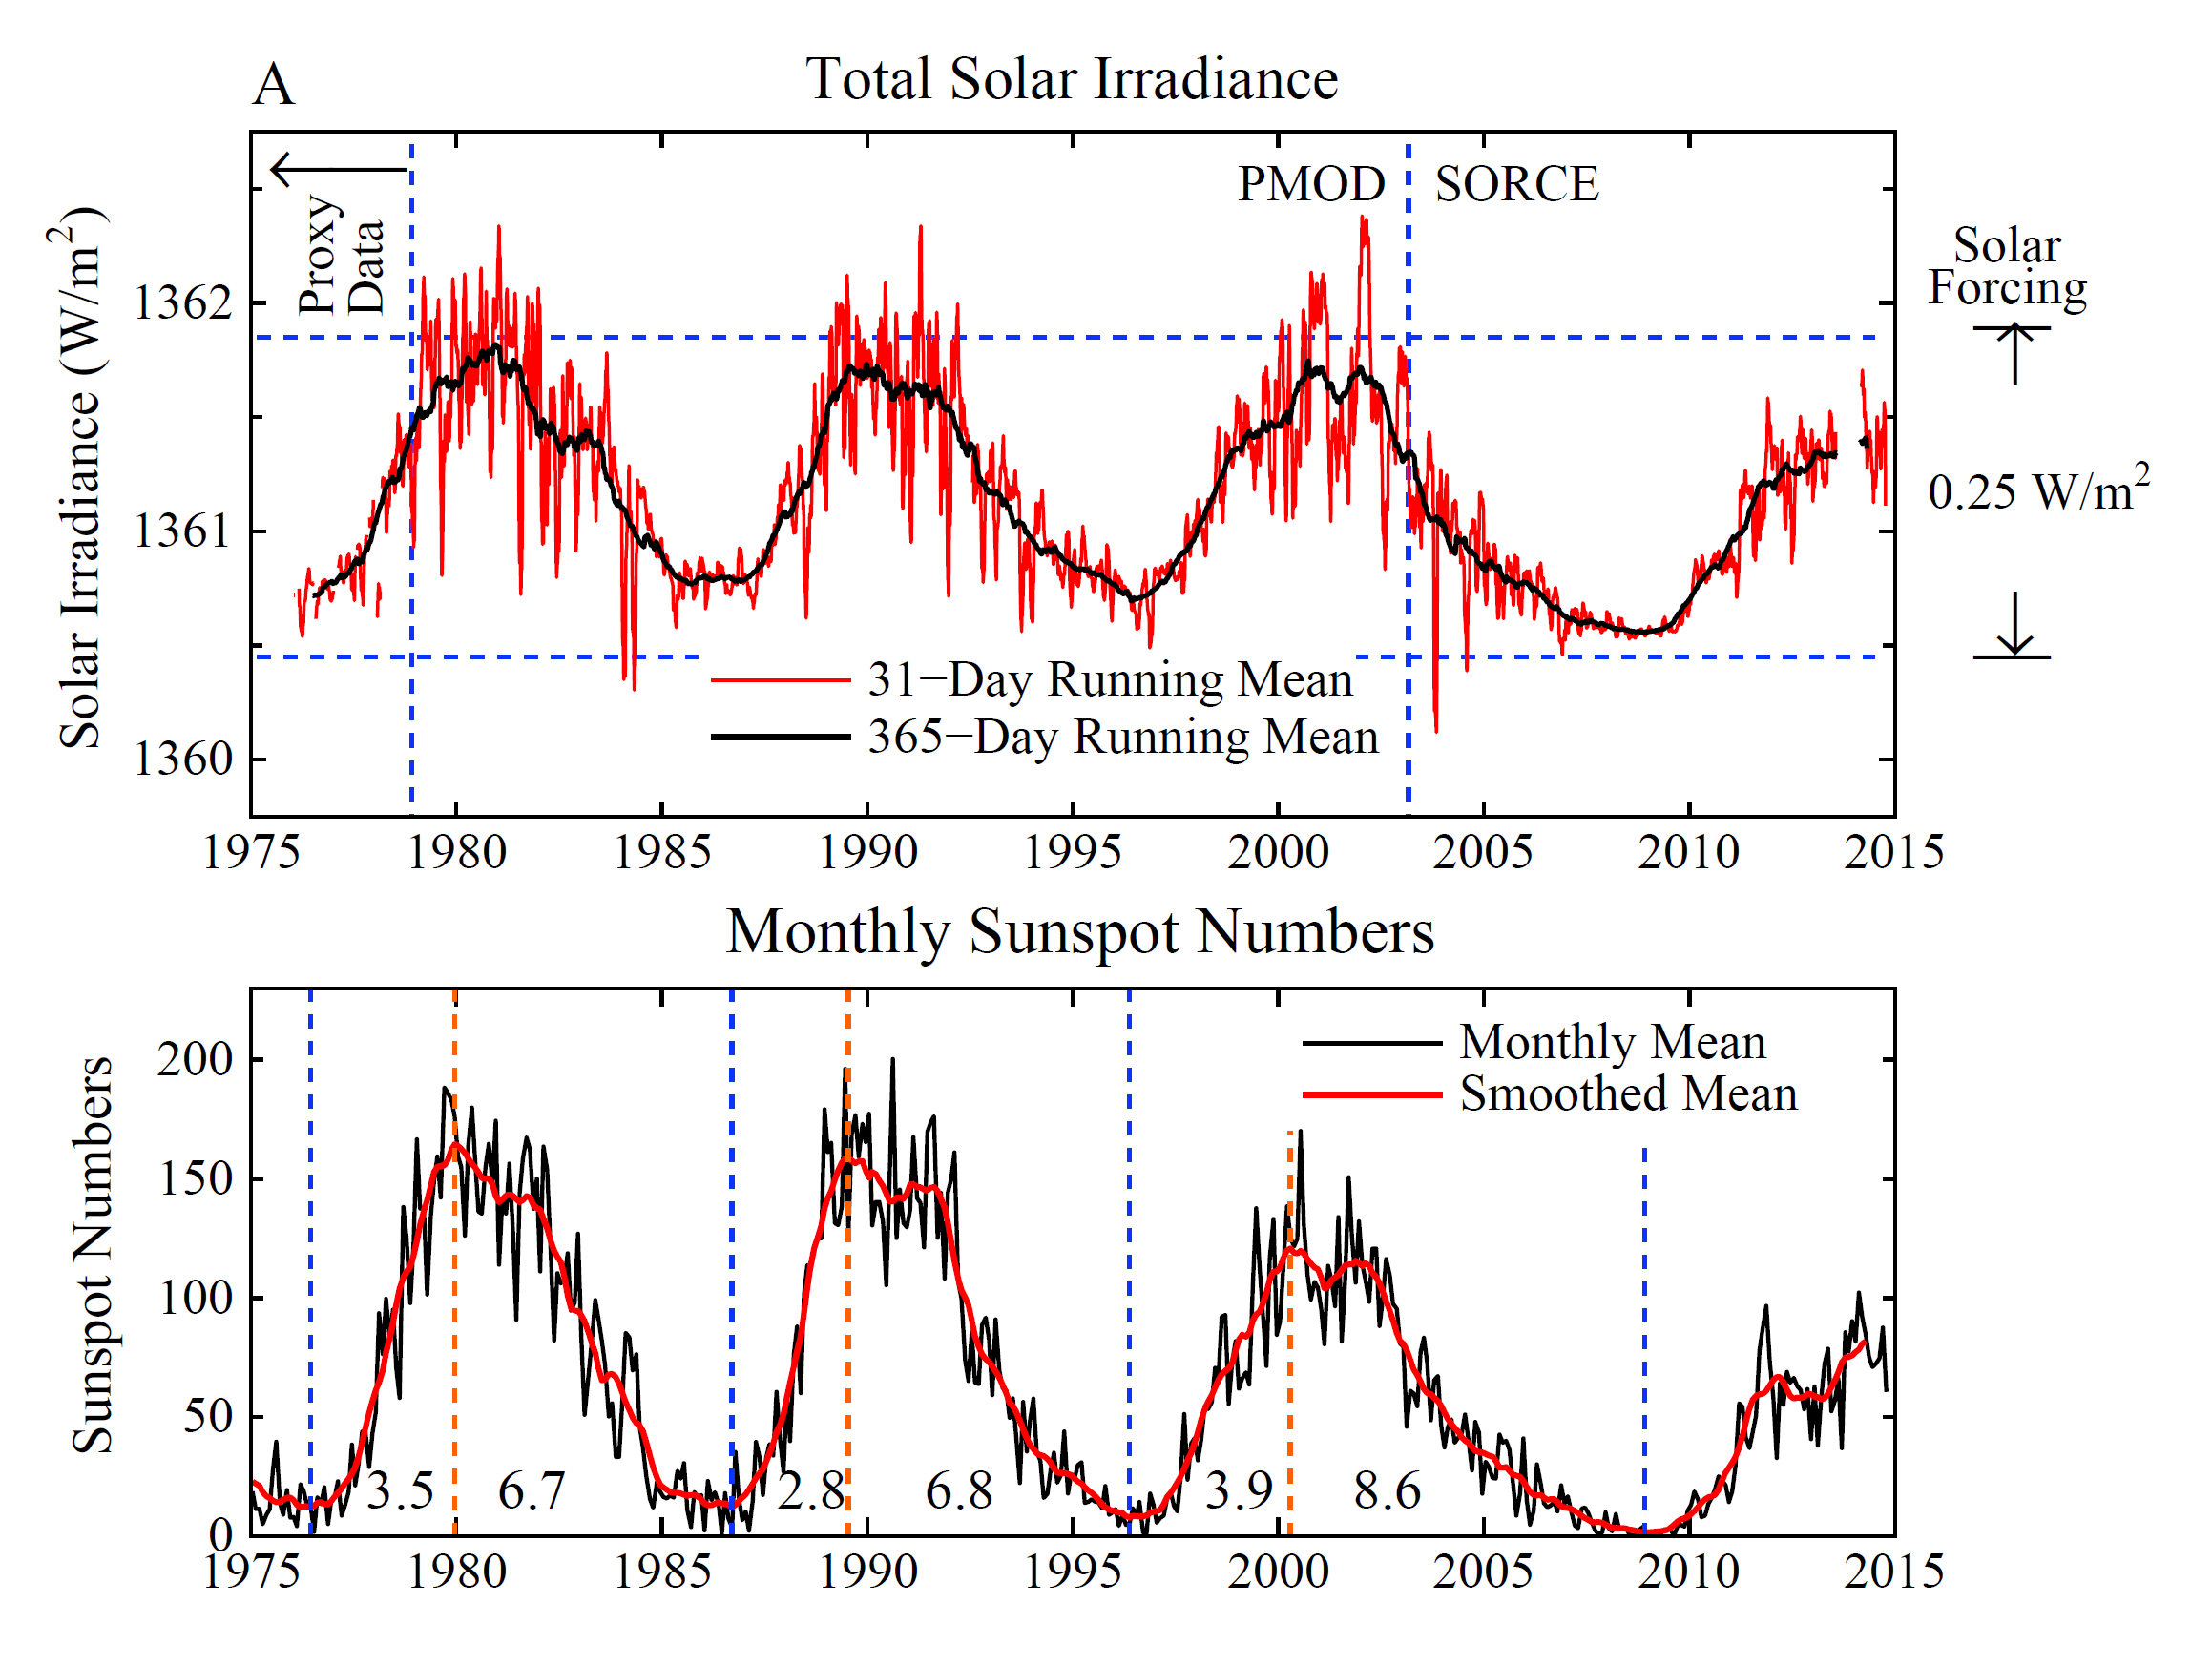
English: These two graphs show changes in total solar irradiance (TSI, labelled "A") and monthly sunspot numbers ("B") between approximately 1975 to 2013. TSI is measured in watts per square metre (W.m-2), with 31-day and 365-day running means plotted. The 31-day mean shows more variability than the 365-day mean. Both curves show a pattern of peaks and troughs (see: solar cycle). The range of changes in solar forcing (365-day mean) over the time period is 0.25 W.m2.
Graph B plots a monthly mean and smoothed mean, with the monthly mean showing more variability than the smoothed mean. The pattern of peaks and troughs in total solar irradiance is replicated in this graph of monthly sunspot numbers. A summary of the data is given in a later section. |
| తేదీ | |
| మూలం |
|
| కర్త | Hansen J, Kharecha P, Sato M, Masson-Delmotte V, Ackerman F, et al. |
Data
Values are approximate. See Hansen et al. for original data sources. For TSI and monthly sunspot numbers, data are given for the 365-day mean and smoothed mean, respectively. Values are given that correspond to peaks and troughs in the curves, as well as values at the beginning and end of the time period (approximately 1977 and 2014).
| Year | TSI |
|---|---|
| 1977 | 1360.75 |
| 1981 | 1361.85 |
| 1986 | 1360.75 |
| 1991 | 1361.6 |
| 1996 | 1360.75 |
| 2001 | 1361.7 |
| 2009 | 1360.55 |
| 2013 | 1361.35 |
| Year | Sunspot No. |
|---|---|
| 1977 | 15 |
| 1980 | 160 |
| 1987 | 15 |
| 1991 | 145 |
| 1997 | 10 |
| 2001 | 105 |
| 2009 | 3 |
| 2014 | 85 |
లైసెన్సింగ్
| ఈ దస్త్రం క్రియేటివ్ కామన్స్ CC0 వెయివర్ క్రింద లభ్యం. | |
| ఈ కృతితో సంబంధమున్న వ్యక్తి తనకు ప్రపంచవ్యాప్తంగా కాపీహక్కుల చట్టం క్రింద ఈ కృతిపై ఉన్న అన్ని హక్కులని మరియు ఈ కృతిలో తనకి ఉన్న సంబంధిత న్యాయపరమైన హక్కులని, చట్టం అనుమతించిన మేరకు, వదులుకుని ఈ కృతిని కామన్స్కి అంకితమిచ్చారు. CC0 క్రింద ఉన్న కృతులకు ఆపాందింపు అవసరం లేదు. కృతిని ఉటంకించేప్పుడు, కృతికర్త యొక్క ఆమోదాన్ని మీరు అంతర్నిహితంగా సూచించకూడదు.
|
| Annotations | This image is annotated: View the annotations at Commons |
ఫైలు చరితం
తేదీ/సమయం ను నొక్కి ఆ సమయాన ఫైలు ఎలా ఉండేదో చూడవచ్చు.
| తేదీ/సమయం | నఖచిత్రం | కొలతలు | వాడుకరి | వ్యాఖ్య | |
|---|---|---|---|---|---|
| ప్రస్తుత | 07:49, 21 నవంబరు 2014 | | 2,318 × 1,746 (289 KB) | Enescot | {{Information |Description ={{en|1=These two graphs show changes in total solar irradiance (TSI, labelled "A") and monthly sunspot numbers ("B") between approximately 1975 to 2013. TSI is measured in wa... |
లింకులు
ఈ ఫైలును వాడుతున్న పేజీలు లేవు.
సార్వత్రిక ఫైలు వాడుక
ఈ దస్త్రాన్ని ఈ క్రింది ఇతర వికీలు ఉపయోగిస్తున్నాయి:
- de.wikipedia.org లో వాడుక
- es.wikipedia.org లో వాడుక
- ga.wikipedia.org లో వాడుక