దస్త్రం:Evolution of temperature in the Post-Glacial period according to Greenland ice cores.jpg
Jump to navigation
Jump to search
ఈ మునుజూపు పరిమాణం: 800 × 222 పిక్సెళ్ళు. ఇతర రిజల్యూషన్లు: 320 × 89 పిక్సెళ్ళు | 640 × 178 పిక్సెళ్ళు | 1,786 × 496 పిక్సెళ్ళు.
అసలు దస్త్రం (1,786 × 496 పిక్సెళ్ళు, ఫైలు పరిమాణం: 281 KB, MIME రకం: image/jpeg)
This is a file from the Wikimedia Commons. Information from its description page there is shown below. Commons is a freely licensed media file repository. You can help. |
సారాంశం
| వివరణ |
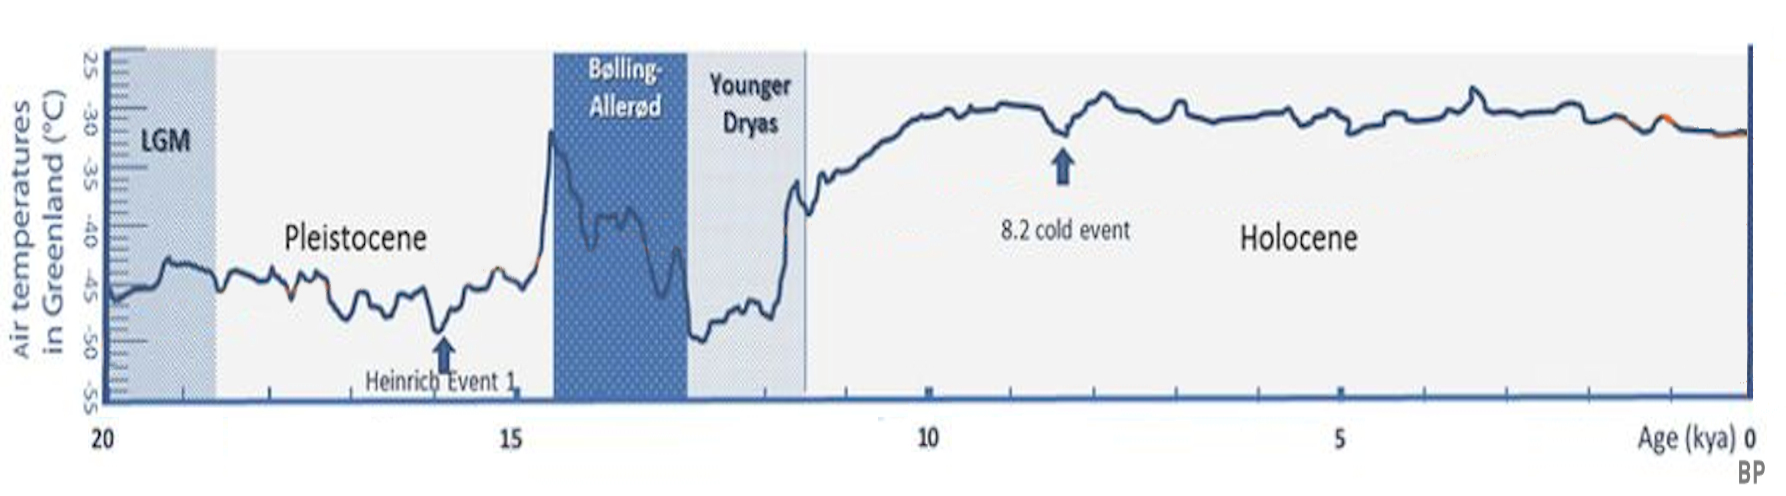
English: Reconstructed air temperatures from the GISP 2 Ice core in Greenland |
||
| తేదీ | |||
| మూలం |
Mapping Post-Glacial expansions: The Peopling of Southwest Asia |
||
| కర్త | Daniel E. Platt, Marc Haber, Magda Bou Dagher-Kharrat, Bouchra Douaihy, Georges Khazen, Maziar Ashrafian Bonab, Angélique Salloum, Francis Mouzaya, Donata Luiselli, Chris Tyler-Smith, Colin Renfrew, Elizabeth Matisoo-Smith & Pierre A. Zalloua | ||
| ఇతర కూర్పులు |
|


లైసెన్సింగ్
This file is licensed under the Creative Commons Attribution-Share Alike 4.0 International license.
- ఇలా చేసేందుకు మీకు స్వేచ్ఛ ఉంది:
- పంచుకోడానికి – ఈ కృతిని కాపీ చేసుకోవచ్చు, పంపిణీ చేయవచ్చు, ప్రసారమూ చేయవచ్చు
- రీమిక్స్ చేయడానికి – కృతిని అనుకరించడానికి
- క్రింది షరతులకు లోబడి:
- ఆపాదింపు – సముచితమైన శ్రేయస్సును ఇవ్వాలి, లైసెన్సుకు లింకు ఇవ్వాలి, మార్పులేమైనా చేస్తే వాటిని సూచించాలి. అందుకు సముచితమైన పద్ధతి దేన్నైనా అవలంబించవచ్చు. కానీ మీకూ మీ వాడుకకూ హక్కుదారు అనుమతించారు అనే అర్థం వచ్చేటట్లుగా మాత్రం కాదు.
- share alike – మీరు ఈ కృతిని అనుకరిస్తే, మారిస్తే, లేదా మెరుగుపరిస్తే తత్ఫలిత కృతిని ఇదే లైసెన్సు లేదా దీనికి అనుగుణ్యమైన లైసెన్సు క్రింద మాత్రమే పంపిణీ చేయాలి.
ఫైలు చరితం
తేదీ/సమయం ను నొక్కి ఆ సమయాన ఫైలు ఎలా ఉండేదో చూడవచ్చు.
| తేదీ/సమయం | నఖచిత్రం | కొలతలు | వాడుకరి | వ్యాఖ్య | |
|---|---|---|---|---|---|
| ప్రస్తుత | 20:41, 16 మే 2019 | 1,786 × 496 (281 KB) | पाटलिपुत्र | better | |
| 11:24, 16 మే 2019 | 1,786 × 372 (238 KB) | पाटलिपुत्र | User created page with UploadWizard |
లింకులు
కింది పేజీలలో ఈ ఫైలుకు లింకులు ఉన్నాయి:
సార్వత్రిక ఫైలు వాడుక
ఈ దస్త్రాన్ని ఈ క్రింది ఇతర వికీలు ఉపయోగిస్తున్నాయి:
- af.wikipedia.org లో వాడుక
- ar.wikipedia.org లో వాడుక
- ca.wikipedia.org లో వాడుక
- de.wikipedia.org లో వాడుక
- en.wikipedia.org లో వాడుక
- es.wikipedia.org లో వాడుక
- fr.wikipedia.org లో వాడుక
- he.wikipedia.org లో వాడుక
- id.wikipedia.org లో వాడుక
- ie.wikipedia.org లో వాడుక
- it.wikipedia.org లో వాడుక
- ja.wikipedia.org లో వాడుక
- kk.wikipedia.org లో వాడుక
- lfn.wikipedia.org లో వాడుక
- ms.wikipedia.org లో వాడుక
- ru.wikipedia.org లో వాడుక
- th.wikipedia.org లో వాడుక
- tr.wikipedia.org లో వాడుక
- vi.wikipedia.org లో వాడుక
- zh.wikipedia.org లో వాడుక