దస్త్రం:Population of Israel.png
Jump to navigation
Jump to search

ఈ మునుజూపు పరిమాణం: 636 × 599 పిక్సెళ్ళు. ఇతర రిజల్యూషన్లు: 255 × 240 పిక్సెళ్ళు | 509 × 480 పిక్సెళ్ళు | 815 × 768 పిక్సెళ్ళు | 1,087 × 1,024 పిక్సెళ్ళు | 1,592 × 1,500 పిక్సెళ్ళు.
అసలు దస్త్రం (1,592 × 1,500 పిక్సెళ్ళు, ఫైలు పరిమాణం: 165 KB, MIME రకం: image/png)
This is a file from the Wikimedia Commons. Information from its description page there is shown below. Commons is a freely licensed media file repository. You can help. |

|
This graph image could be re-created using vector graphics as an SVG file. This has several advantages; see Commons:Media for cleanup for more information. If an SVG form of this image is available, please upload it and afterwards replace this template with
{{vector version available|new image name}}.
It is recommended to name the SVG file “Population of Israel.svg”—then the template Vector version available (or Vva) does not need the new image name parameter. |
| వివరణ |
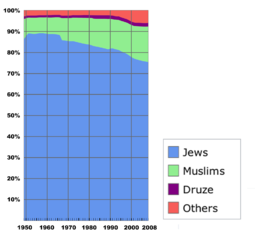
English: Population chart of Israel, by religion, from 1949 to 2008 |
| తేదీ | (UTC) |
| మూలం | |
| కర్త |
|
| This is a retouched picture, which means that it has been digitally altered from its original version. Modifications: full chart + fixed fonts. The original can be viewed here: Population of Israel.svg:
|
నేను, ఈ కృతి యొక్క కాపీహక్కుదారుని, దీన్ని ఈ లైసెన్సు క్రింద ఇందుమూలముగా ప్రచురిస్తున్నాను:
| నేను, ఈ కృతి యొక్క కాపీహక్కుదారుని, ఈ కృతిని సార్వజనీనం'గా విడుదల చేస్తున్నాను. ఇది ప్రపంచవ్యాప్తంగా వర్తిస్తుంది. కొన్ని దేశాల్లో ఇది చట్టబద్ధంగా సాధ్యంకాకపోవచ్చు; అయితే: ఈ కృతిని ఎటువంటి షరతులు లేకుండా, అట్టి షరతులు చట్టం వల్ల తప్పనిసరి అయితే తప్ప, ఏ ఉద్దేశానికైనా ఉపయోగించుకునే హక్కును ఎవరికైనా నేను ప్రదానం చేస్తున్నాను. |
అసలు ఎక్కింపుల చిట్టా
This image is a derivative work of the following images:
- File:Population_of_Israel.svg licensed with PD-self
- 2009-09-17T09:09:11Z Demmo 600x500 (11736 Bytes) {{Information |Description={{en|1=Population chart of Israel, since 1949}} |Source=Own work by uploader |Author=[[User:Demmo|Demmo]] |Date=2009-09-17 |Permission= |other_versions= }} [[Category:Demographics of Israel]]
Uploaded with derivativeFX
సారాంశం
Israeli population in thousands. Compiled from data from the Central Bureau of Statistics. [1]
Data 2009 onwards hasn't been added to the "graph".
| ___Year___ | ___Jews___ | ___Muslims___ | ___Druze___ | ___Grand Total___ |
| 1949 | 1,013.9 | 111.5 | 14.5 | 1,173.9 |
| 1950 | 1,203.0 | 116.1 | 15.0 | 1,370.1 |
| 1951 | 1,404.4 | 118.9 | 15.5 | 1,577.8 |
| 1952 | 1,450.2 | 122.8 | 16.1 | 1,629.5 |
| 1953 | 1,483.6 | 127.5 | 16.8 | 1,669.4 |
| 1954 | 1,526.0 | 131.8 | 18.0 | 1,717.8 |
| 1955 | 1,590.5 | 136.2 | 19.0 | 1,789.1 |
| 1956 | 1,667.5 | 141.3 | 19.8 | 1,872.4 |
| 1957 | 1,762.8 | 146.8 | 20.5 | 1,976.0 |
| 1958 | 1,810.2 | 152.8 | 21.4 | 2,031.7 |
| 1959 | 1,858.8 | 159.2 | 22.3 | 2,088.7 |
| 1960 | 1,911.3 | 166.3 | 23.3 | 2,150.4 |
| 1961(4) | 1,981.7 | 174.9 | 26.3 | 2,234.2 |
| 1962 | 2,068.9 | 183.0 | 27.3 | 2,331.8 |
| 1963 | 2,155.6 | 192.2 | 28.5 | 2,430.1 |
| 1964 | 2,239.2 | 202.3 | 28.6 | 2,525.6 |
| 1965 | 2,299.1 | 212.4 | 29.8 | 2,598.4 |
| 1966 | 2,344.9 | 223.0 | 31.0 | 2,657.4 |
| 1967 | 2,383.6 | 289.6 | 32.1 | 2,776.3 |
| 1968 | 2,434.8 | 300.8 | 33.3 | 2,841.1 |
| 1969 | 2,506.8 | 314.5 | 34.6 | 2,929.5 |
| 1970 | 2,582.0 | 328.6 | 35.9 | 3,022.1 |
| 1971 | 2,662.0 | 344.0 | 37.3 | 3,120.7 |
| 1972(4) | 2,752.7 | 360.6 | 37.8 | 3,225.0 |
| 1973 | 2,845.0 | 377.2 | 39.3 | 3,338.2 |
| 1974 | 2,906.9 | 395.2 | 40.8 | 3,421.6 |
| 1975 | 2,959.4 | 411.4 | 42.2 | 3,493.2 |
| 1976 | 3,020.4 | 429.0 | 43.9 | 3,575.4 |
| 1977 | 3,077.3 | 446.5 | 45.6 | 3,653.2 |
| 1978 | 3,141.2 | 463.5 | 47.3 | 3,737.6 |
| 1979 | 3,218.4 | 481.2 | 49.0 | 3,836.2 |
| 1980 | 3,282.7 | 498.3 | 50.7 | 3,921.7 |
| 1981 | 3,320.3 | 513.7 | 52.3 | 3,977.7 |
| 1982 | 3,373.2 | 530.8 | 65.6 | 4,063.6 |
| 1983(4) | 3,412.5 | 542.2 | 68.0 | 4,118.6 |
| 1984 | 3,471.7 | 559.7 | 70.0 | 4,199.7 |
| 1985 | 3,517.2 | 577.6 | 72.0 | 4,266.2 |
| 1986 | 3,561.4 | 595.0 | 74.0 | 4,331.3 |
| 1987 | 3,612.9 | 614.5 | 76.1 | 4,406.5 |
| 1988 | 3,659.0 | 634.6 | 78.1 | 4,476.8 |
| 1989 | 3,717.1 | 655.2 | 80.3 | 4,559.6 |
| 1990 | 3,946.7 | 677.7 | 82.6 | 4,821.7 |
| 1991 | 4,144.6 | 701.4 | 84.8 | 5,058.8 |
| 1992 | 4,242.5 | 725.4 | 87.1 | 5,195.9 |
| 1993 | 4,335.2 | 751.4 | 89.3 | 5,327.6 |
| 1994 | 4,441.1 | 781.5 | 91.7 | 5,471.5 |
| 1995(4) | 4,522.3 | 811.2 | 92.2 | 5,612.3 |
| 1996 | 4,616.1 | 839.9 | 94.5 | 5,757.9 |
| 1997 | 4,701.6 | 867.9 | 96.7 | 5,900.0 |
| 1998 | 4,785.1 | 899.8 | 99.0 | 6,041.4 |
| 1999 | 4,872.8 | 934.1 | 101.2 | 6,209.1 |
| 2000 | 4,955.4 | 970.0 | 103.8 | 6,369.3 |
| 2001 | 5,025.0 | 1,004.6 | 106.3 | 6,508.8 |
| 2002 | 5,094.2 | 1,038.3 | 108.5 | 6,631.1 |
| 2003 | 5,165.4 | 1,072.5 | 110.8 | 6,748.4 |
| 2004 | 5,237.6 | 1,107.4 | 113.0 | 6,869.5 |
| 2005 | 5,313.8 | 1,140.6 | 115.2 | 6,990.7 |
| 2006 | 5,393.4 | 1,173.1 | 117.5 | 7,116.7 |
| 2007 | 5,478.2 | 1,206.1 | 119.7 | 7,243.6 |
| 2008 | 5,569.2 | 1,240.0 | 121.9 | 7,374.0 |
| 2009 | 5,685.8 | 1,275.2 | 124.4 | 7,535.0 |
| 2010 | 5,806.5 | 1,311.4 | 127.0 | 7,701.3 |
| 2011 | 5,928.0 | 1,346.7 | 129.5 | 7,867.6 |
| 2012 | 6,053.4 | 1,382.7 | 131.9 | 8,038.5 |
| 2013 | 6,180.5 | 1,417.5 | 134.3 | 8,209.74 |
ఫైలు చరితం
తేదీ/సమయం ను నొక్కి ఆ సమయాన ఫైలు ఎలా ఉండేదో చూడవచ్చు.
| తేదీ/సమయం | నఖచిత్రం | కొలతలు | వాడుకరి | వ్యాఖ్య | |
|---|---|---|---|---|---|
| ప్రస్తుత | 05:28, 29 జూన్ 2010 | | 1,592 × 1,500 (165 KB) | TheCuriousGnome | {{Information |Description={{en|1=Population chart of Israel, since 1949}} |Source=*File:Population_of_Israel.svg |Date=2010-06-29 05:27 (UTC) |Author=*File:Population_of_Israel.svg: Demmo *derivative work: ~~~ |Permission=see b |
లింకులు
కింది పేజీలలో ఈ ఫైలుకు లింకులు ఉన్నాయి:
సార్వత్రిక ఫైలు వాడుక
ఈ దస్త్రాన్ని ఈ క్రింది ఇతర వికీలు ఉపయోగిస్తున్నాయి:
- en.wikipedia.org లో వాడుక
- eu.wikipedia.org లో వాడుక
- fa.wikipedia.org లో వాడుక
- nn.wikipedia.org లో వాడుక
- zh.wikipedia.org లో వాడుక