దస్త్రం:Sine wavelength.svg
Jump to navigation
Jump to search

ఈ ఫైలు SVG కు చెందిన ఈ మునుజూపు PNG పరిమాణం: 512 × 356 పిక్సెళ్ళు. ఇతర రిజల్యూషన్లు: 320 × 223 పిక్సెళ్ళు | 640 × 445 పిక్సెళ్ళు | 1,024 × 712 పిక్సెళ్ళు | 1,280 × 890 పిక్సెళ్ళు | 2,560 × 1,780 పిక్సెళ్ళు.
అసలు దస్త్రం (SVG ఫైలు, నామమాత్రంగా 512 × 356 పిక్సెళ్ళు, ఫైలు పరిమాణం: 26 KB)
This is a file from the Wikimedia Commons. Information from its description page there is shown below. Commons is a freely licensed media file repository. You can help. |
సారాంశం
| వివరణ |
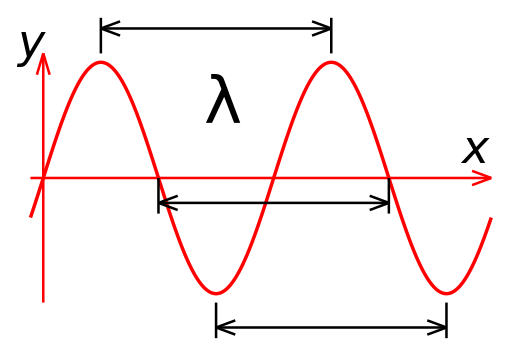
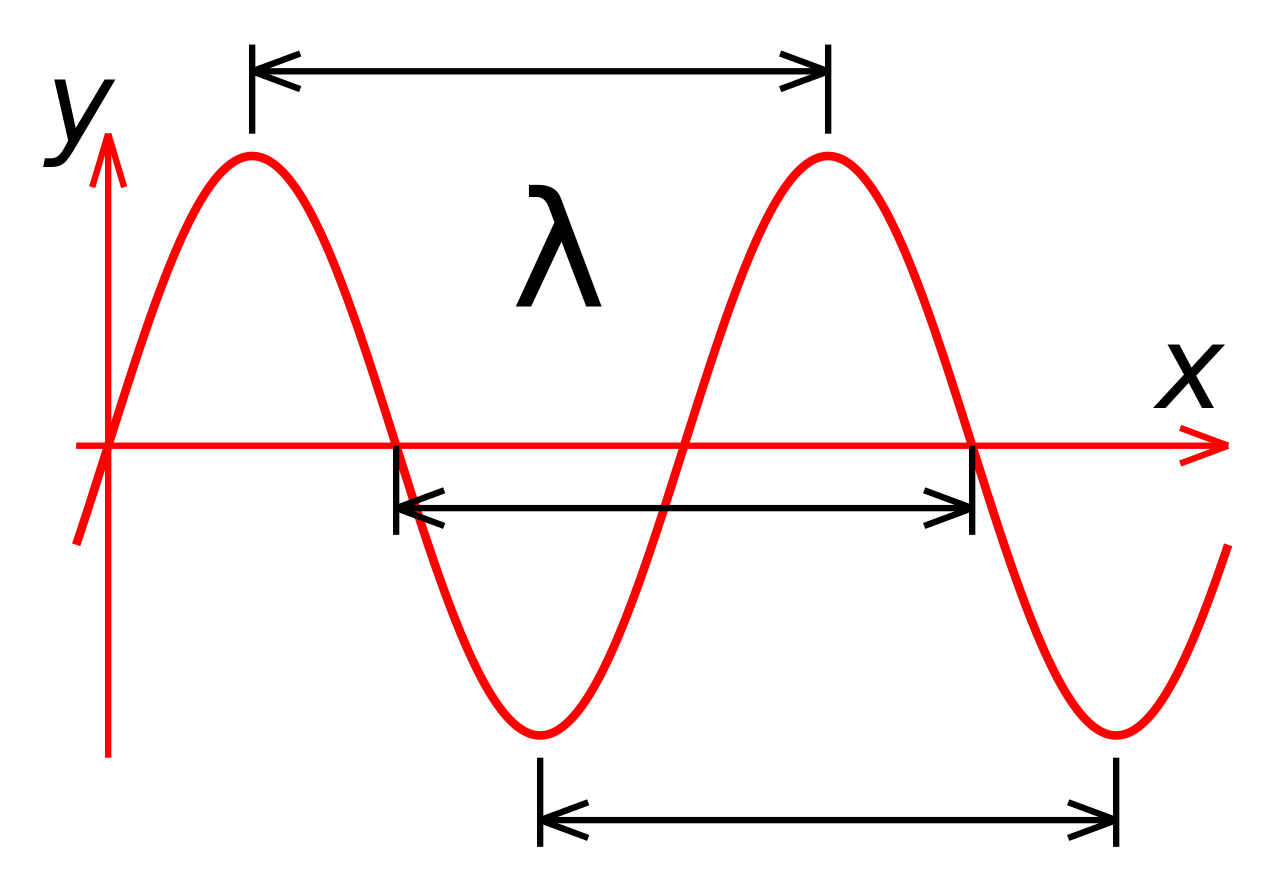
English: Plot of a sine wave, showing three pairs of corresponding points between which wavelength (lambda) can be measured. |
| తేదీ | |
| మూలం | స్వంత కృతి |
| కర్త | Dicklyon (Richard F. Lyon) |
లైసెన్సింగ్
నేను, ఈ కృతి యొక్క కాపీహక్కుదారుని, దీన్ని ఈ లైసెన్సు క్రింద ఇందుమూలముగా ప్రచురిస్తున్నాను:
ఈ దస్త్రం క్రియేటివ్ కామన్స్ Attribution-Share Alike 3.0 Unported లైసెన్సు క్రింద లభ్యం.
- ఇలా చేసేందుకు మీకు స్వేచ్ఛ ఉంది:
- పంచుకోడానికి – ఈ కృతిని కాపీ చేసుకోవచ్చు, పంపిణీ చేయవచ్చు, ప్రసారమూ చేయవచ్చు
- రీమిక్స్ చేయడానికి – కృతిని అనుకరించడానికి
- క్రింది షరతులకు లోబడి:
- ఆపాదింపు – సముచితమైన శ్రేయస్సును ఇవ్వాలి, లైసెన్సుకు లింకు ఇవ్వాలి, మార్పులేమైనా చేస్తే వాటిని సూచించాలి. అందుకు సముచితమైన పద్ధతి దేన్నైనా అవలంబించవచ్చు. కానీ మీకూ మీ వాడుకకూ హక్కుదారు అనుమతించారు అనే అర్థం వచ్చేటట్లుగా మాత్రం కాదు.
- share alike – మీరు ఈ కృతిని అనుకరిస్తే, మారిస్తే, లేదా మెరుగుపరిస్తే తత్ఫలిత కృతిని ఇదే లైసెన్సు లేదా దీనికి అనుగుణ్యమైన లైసెన్సు క్రింద మాత్రమే పంపిణీ చేయాలి.
Source (Asymptote)
import graph;
size(200,100,IgnoreAspect);

real f(real x) {
  return sin(2*pi*x);
}

string fmt(real x) {
  return "";
}

draw(graph(f, 0, 2, operator..), red);
xaxis("$x$",Ticks(N=0,n=4,Step=0.5,ticklabel=fmt));
yaxis("$y(x)$",Ticks(N=0,n=4,Step=1, ticklabel=fmt));

Label lambda=Label("$\lambda$",align=N,blue);
draw(L=lambda, (0.25, 1) -- (1.25, 1), blue, Arrows);
draw(L=lambda, (0.50, 0) -- (1.50, 0), blue, Arrows);
draw(L=lambda, (0.75,-1) -- (1.75,-1), blue, Arrows);
ఫైలు చరితం
తేదీ/సమయం ను నొక్కి ఆ సమయాన ఫైలు ఎలా ఉండేదో చూడవచ్చు.
| తేదీ/సమయం | నఖచిత్రం | కొలతలు | వాడుకరి | వ్యాఖ్య | |
|---|---|---|---|---|---|
| ప్రస్తుత | 10:47, 30 అక్టోబరు 2021 | | 512 × 356 (26 KB) | Upload77 | Reverted to version as of 06:13, 2 July 2009 (UTC) |
| 21:29, 27 జనవరి 2014 |  | 600 × 300 (18 KB) | Patrick87 | use generic axes labels (specification of wavelengths on a time or frequency axis as in previous version does not make sense) | |
| 20:54, 5 ఆగస్టు 2013 |  | 251 × 125 (25 KB) | Rayhem | Clearer markings, Asymptote source code | |
| 06:13, 2 జూలై 2009 |  | 512 × 356 (26 KB) | Dicklyon | {{Information |Description={{en|1=Plot of a sine wave, showing three pairs of corresponding points between which wavelength (lambda) can be measured.}} |Source=Own work by uploader |Author=Dicklyon (Richard F. Lyon) |Date=July 1 2009 |Pe |
లింకులు
కింది పేజీలలో ఈ ఫైలుకు లింకులు ఉన్నాయి:
సార్వత్రిక ఫైలు వాడుక
ఈ దస్త్రాన్ని ఈ క్రింది ఇతర వికీలు ఉపయోగిస్తున్నాయి:
- am.wikipedia.org లో వాడుక
- ar.wikipedia.org లో వాడుక
- ary.wikipedia.org లో వాడుక
- azb.wikipedia.org లో వాడుక
- az.wikipedia.org లో వాడుక
- be-tarask.wikipedia.org లో వాడుక
- be.wikipedia.org లో వాడుక
- bn.wikipedia.org లో వాడుక
- cv.wikipedia.org లో వాడుక
- de.wikipedia.org లో వాడుక
- en.wikipedia.org లో వాడుక
- en.wikibooks.org లో వాడుక
- en.wiktionary.org లో వాడుక
- es.wikipedia.org లో వాడుక
- et.wikipedia.org లో వాడుక
- fi.wiktionary.org లో వాడుక
- fr.wikipedia.org లో వాడుక
- gl.wiktionary.org లో వాడుక
- he.wikipedia.org లో వాడుక
- he.wikibooks.org లో వాడుక
- he.wiktionary.org లో వాడుక
- hr.wikipedia.org లో వాడుక
- ht.wikipedia.org లో వాడుక
- hy.wikipedia.org లో వాడుక
- id.wikipedia.org లో వాడుక
- ja.wikipedia.org లో వాడుక
- ka.wikipedia.org లో వాడుక
- kk.wikipedia.org లో వాడుక
- ko.wikipedia.org లో వాడుక
- la.wikipedia.org లో వాడుక
- lv.wikipedia.org లో వాడుక
- mk.wikipedia.org లో వాడుక
- pa.wikipedia.org లో వాడుక
- pnb.wikipedia.org లో వాడుక
- ps.wikipedia.org లో వాడుక
- ru.wikipedia.org లో వాడుక
- sh.wikipedia.org లో వాడుక
- si.wikipedia.org లో వాడుక
- sl.wikipedia.org లో వాడుక
- so.wikipedia.org లో వాడుక
ఈ దస్త్రపు మరింత సార్వత్రిక వాడుకను చూడండి.