
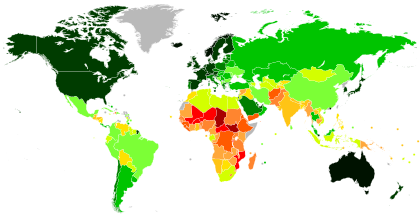
మానవాభివృద్ధి సూచిక

- చాలా ఎక్కువ (≥ 0.800)
- ఎక్కువ (0.700–0.799)
- మధ్యస్థం (0.550–0.699)
- తక్కువ (≤ 0.549)
- డేటా అందుబాటులో లేదు
- ≥ 0.950
- 0.900–0.950
- 0.850–0.899
- 0.800–0.849
- 0.750–0.799
- 0.700–0.749
- 0.650–0.699
- 0.600–0.649
- 0.550–0.599
- 0.500–0.549
- 0.450–0.499
- 0.400–0.449
- ≤ 0.399
- డేటా అందుబాటులో లేదు
మానవాభివృద్ధి సూచిక (హ్యూమన్ డెవలప్మెంట్ ఇండెక్స్ - హెచ్డిఐ) అనేది మానవుల ఆయుర్దాయం, విద్య (చదివిన సగటు సంవత్సరాలు), తలసరి ఆదాయ గణాంకాల మిశ్రమ సూచిక. దీని ద్వారా ప్రపంచ దేశాలను నాలుగు మానవ అభివృద్ధి ర్యాంకులుగా విభజించారు. జీవితకాలం ఎక్కువగా, విద్యా స్థాయి ఎక్కువగా, తలసరి స్థూల జాతీయ ఆదాయం ఎక్కువగానూ ఉన్నప్పుడు ఆ దేశానికి HDI అధికంగా ఉంటుంది. దీనిని పాకిస్తానీ ఆర్థికవేత్త మహబూబ్ ఉల్ హక్ అభివృద్ధి చేశాడు. యునైటెడ్ నేషన్స్ డెవలప్మెంట్ ప్రోగ్రామ్ (UNDP) వారి హ్యూమన్ డెవలప్మెంట్ రిపోర్ట్ ఆఫీసు దేశాల అభివృద్ధిని కొలవడానికి దీన్ని ఉపయోగిస్తుంది. [1] [2]
మానవ సామర్థ్యాలపై అమర్త్య సేన్ చేసిన కృషి నుండి ఉత్తేజితుడై మహబూబ్ ఉల్ హక్ అభివృద్ధి చేసిన మానవ అభివృద్ధి విధానంపై ఈ సూచిక ఆధారపడి ఉంటుంది. ప్రజలు జీవితంలో కావాల్సిన విధంగా "ఉండగలరా" కావాల్సిన వాటిని "చేయగలరా" అనే వాటిపై ఆధారపడి దీన్ని రూపొందించారు. ఉదాహరణలు - ఉండగలగటం: మంచి ఆహారం, ఆవాసం, ఆరోగ్యం; చేయగలగడం: పని, విద్య, ఓటింగు, సామాజిక జీవితంలో పాల్గొనడం. ఎంచుకునే స్వేచ్ఛ ప్రధానమైనది - ఆహారం కొనలేని కారణంగా పస్తు ఉండడం లేదా దేశం కరువులో ఉన్నందున పస్తులుండడం అనేది మతపరమైన, తదితర కారణాలతో ఉపవాసం ఉండడం కంటే విభిన్నమైనది. [3]
ఈ సూచిక తలసరి నికర సంపదను గానీ, దేశంలోని వస్తువుల సాపేక్ష నాణ్యత వంటి అనేక అంశాలను గానీ పరిగణనలోకి తీసుకోదు. ఈ పరిస్థితి వలన G7 సభ్యులు, తదితర అత్యంత అభివృద్ధి చెందిన కొన్ని దేశాలకు ర్యాంకింగ్ను తగ్గుతుంది. [4]
అవతరణ
[మార్చు]ఐక్యరాజ్యసమితి అభివృద్ధి కార్యక్రమం (UNDP) వారి మానవ అభివృద్ధి నివేదిక కార్యాలయం రూపొందించిన వార్షిక మానవ అభివృద్ధి నివేదికలలో HDI కి మూలాలు ఉన్నాయి. వీటిని 1990లో పాకిస్తానీ ఆర్థికవేత్త మహబూబ్ ఉల్ హక్ రూపొందించాడు. "అభివృద్ధి ఆర్థికాంశాల దృష్టిని జాతీయ ఆదాయ లెక్కల నుండి ప్రజలు కేంద్రంగా ఉండే విధానాలకు మార్చడం" అనే స్పష్టమైన ఉద్దేశం ఇందులో ఉంది. అభివృద్ధిని ఆర్థిక పురోగతి ద్వారా మాత్రమే కాకుండా ప్రజల సంక్షేమంలో మెరుగుదల ద్వారా కూడా అంచనా వేయవచ్చు, అంచనా వేయాలి అని ప్రజలను, విద్యావేత్తలను, రాజకీయ నాయకులనూ ఒప్పించేందుకు మానవాభివృద్ధికి చెందిన సరళమైన సమ్మేళనం ఒకటి అవసరమని హక్ విశ్వసించాడు.
కొలతలు, గణన
[మార్చు]కొత్త పద్ధతి (2010 HDI నుండి)
[మార్చు]2010 నవంబర్ 4 న ప్రచురించబడిన (2011 జూన్ 10 న తాజాకరించారు), 2010 మానవ అభివృద్ధి నివేదిక మూడు కోణాలను కలిపి HDIని లెక్కించింది: [5] [6]
- సుదీర్ఘమైన, ఆరోగ్యకరమైన జీవితం: పుట్టినప్పుడు ఆయుర్దాయం
- విద్యార్హత: పాఠశాల విద్య యొక్క సగటు సంవత్సరాలు, పాఠశాల విద్య అంచనా సంవత్సరాలు
- మంచి జీవన ప్రమాణం: తలసరి GNI (PPP అంతర్జాతీయ డాలర్లు )
దాని 2010 మానవ అభివృద్ధి నివేదికలో, UNDP HDIని లెక్కించే కొత్త పద్ధతిని ఉపయోగించడం ప్రారంభించింది. అందుకోసం కింది మూడు సూచికలను ఉపయోగించింది:
1. ఆయుర్దాయం అంచనా సూచిక (LEI)

- పుట్టినప్పుడు ఆయుర్దాయం 85 సంవత్సరాలు ఉంటే LEI 1కి సమానం. పుట్టినప్పుడు ఆయుర్దాయం 20 సంవత్సరాలుగా ఉంటే అప్పుడు అది 0.
2. విద్యా సూచిక (EI) [7]

- 2.1 మీన్ ఇయర్స్ ఆఫ్ స్కూల్లింగ్ ఇండెక్స్ (MYSI)
- 2025 కి ఈ సూచికలో అంచనా వేయబడిన గరిష్ఠం పదిహేను.
- 2.2 స్కూలింగ్ ఇండెక్స్ ఆశించిన సంవత్సరాలు (EYSI) [8]
- చాలా దేశాల్లో మాస్టర్స్ డిగ్రీని సాధించడానికి పద్దెనిమిది సంవత్సరాలు పడుతుంది.


3. ఆదాయ సూచిక (II)

- తలసరి GNI $75,000 అయినప్పుడు II విలువ 1. తలసరి GNI $100 అయినప్పుడు దాని విలువ 0.
చివరగా, HDI అనేది పై మూడు సాధారణ సూచికల రేఖాగణిత సగటు :
![{\displaystyle {\textrm {HDI}}={\sqrt[{3}]{{\textrm {LEI}}\cdot {\textrm {EI}}\cdot {\textrm {II}}}}.}](https://wikimedia.org/api/rest_v1/media/math/render/svg/364ecd910bf260a13250cde6a9d25e08d9633fe8)
LE: పుట్టినప్పుడు ఆయుర్దాయం
MYS: సగటు పాఠశాల విద్య సంవత్సరాలు (అంటే 25 లేదా అంతకంటే ఎక్కువ వయస్సు ఉన్న వ్యక్తి అధికారికంగా విద్య నేర్చిన సంవత్సరాలు)
EYS: ఆశించిన పాఠశాల విద్య సంవత్సరాలు (అనగా 18 సంవత్సరాల కంటే తక్కువ వయస్సు ఉన్న పిల్లల పాఠశాల విద్యా సంవత్సరాల మొత్తం అంచనా)
GNIpc: తలసరి కొనుగోలు శక్తి సమానత్వంలో స్థూల జాతీయ ఆదాయం
2021 నాటి మానవాభివృద్ధి సూచిక (2022 నాటి నివేదిక)
[మార్చు]
ఐక్యరాజ్యసమితి అభివృద్ధి కార్యక్రమం మానవ అభివృద్ధి నివేదిక 2022 ను 2022 సెప్టెంబరు 8 న విడుదల చేసింది. 2021లో సేకరించిన డేటా ఆధారంగా ఈ HDI విలువలను గణించింది.
2021 సంవత్సరంలో 1 నుండి 66 వరకు ర్యాంకు పొందిన క్రింది దేశాలను "బాగా ఉన్నతమైన మానవాభివృద్ధి" సాధించిన దేశాలుగాగా పరిగణిస్తున్నారు. [9]
| Rank | దేశం | HDI | ||
|---|---|---|---|---|
| 2021 డేటా (2022 నివేదిక) | 2015 నుండి మార్పు | 2021 డేటా (2022 నివేదిక)[9] | సగటు వార్షిక వృద్ధి (2010–2021)[10] | |
| 1 | 0.962 | |||
| 2 | 0.961 | |||
| 3 | 0.959 | |||
| 4 | 0.952 | |||
| 5 | 0.951 | |||
| 6 | 0.948 | |||
| 7 | 0.947 | |||
| 8 | 0.945 | |||
| 9 | 0.942 | |||
| 10 | 0.941 | |||
| 11 | 0.940 | |||
| 12 | 0.939 | |||
| 13 | 0.937 | |||
| 15 | 0.936 | |||
| 16 | 0.935 | |||
| 17 | 0.930 | |||
| 18 | 0.929 | |||
| 19 | 0.925 | |||
| 21 | 0.921 | |||
| 22 | 0.919 | |||
| 23 | 0.918 | |||
| 25 | 0.916 | |||
| 26 | 0.911 | |||
| 27 | 0.905 | |||
| 28 | 0.903 | |||
| 29 | 0.896 | |||
| 30 | 0.895 | |||
| 31 | 0.890 | |||
| 32 | మూస:Country data Czechia | 0.889 | ||
| 33 | 0.887 | |||
| 34 | 0.876 | |||
| 35 | 0.875 | |||
| 38 | 0.866 | |||
| 39 | 0.863 | |||
| 40 | 0.858 | |||
| 42 | 0.855 | |||
| 44 | NA[Note 1] | 0.853 | NA[Note 1] | |
| 45 | 0.848 | |||
| 46 | 0.846 | |||
| 47 | 0.842 | |||
| 48 | 0.838 | |||
| 49 | 0.832 | |||
| 50 | 0.831 | |||
| 51 | 0.829 | |||
| 52 | 0.822 | |||
| 53 | 0.821 | |||
| 54 | 0.816 | |||
| 55 | 0.812 | |||
| 56 | 0.811 | |||
| 57 | 0.810 | |||
| 58 | 0.809 | |||
| 60 | 0.808 | |||
| 61 | 0.805 | |||
| 62 | 0.803 | |||
| 63 | 0.802 | |||
| 66 | 0.800 | |||
గత అగ్ర దేశాలు
[మార్చు]దిగువ జాబితా మానవ అభివృద్ధి సూచిక యొక్క ప్రతి సంవత్సరం నుండి అగ్రస్థానంలో ఉన్న దేశాన్ని ప్రదర్శిస్తుంది. నార్వే అత్యధికంగా పదహారు సార్లు, కెనడా ఎనిమిది సార్లు, జపాన్, ఐస్లాండ్లు రెండుసార్లు, స్విట్జర్లాండ్ ఒకసారి ప్రథమ ర్యాంకు పొందాయి.
ప్రతి HDIలోని అగ్ర దేశం
[మార్చు]కింది పట్టికలో చూపిన సంవత్సరం గణాంకాలు రూపొందించిన సంవత్సరం. కుండలీకరణాల్లో ఉన్నది నివేదిక ప్రచురించబడిన సంవత్సరం.
- 2021 (2022):
 స్విట్జర్లాండ్
 - 2019 (2020):
 నార్వే
 - 2018 (2019): నార్వే
- 2017 (2018): నార్వే
- 2015 (2016): నార్వే
- 2014 (2015): నార్వే
- 2013 (2014): నార్వే
- 2012 (2013): నార్వే
- 2011 (2011): నార్వే
- 2010 (2010): నార్వే
- 2007 (2009): నార్వే
- 2006 (2008):
 Iceland
 - 2005 (2007): Iceland
- 2004 (2006): నార్వే
- 2003 (2005): నార్వే
- 2002 (2004): నార్వే
- 2001 (2003): నార్వే
- 2000 (2002): నార్వే
- 1999 (2001): నార్వే
- 1998 (2000):
 కెనడా
కెనడా - 1997 (1999): కెనడా
- 1995 (1998): కెనడా
- 1994 (1997): కెనడా
- 1993 (1996): కెనడా
- 1992 (1995): కెనడా
- ???? (1994): కెనడా
- ???? (1993):
 జపాన్
జపాన్ - 1990 (1992): కెనడా
- 1990 (1991): జపాన్
భౌగోళిక విస్తృతి
[మార్చు]హెచ్డిఐ దాని భౌగోళిక కవరేజీని విస్తరించింది: యునైటెడ్ నేషన్స్ ఎకనామిక్ అండ్ సోషల్ కమిషన్ ఫర్ ఆసియా అండ్ పసిఫిక్కి చెందిన డేవిడ్ హేస్టింగ్స్, హెచ్డిఐని 230 పైచిలుకు ఆర్థిక వ్యవస్థలకు విస్తరింపజేస్తూ ఒక నివేదికను ప్రచురించాడు. 2009కి చెందిన యుఎన్డిపి హెచ్డిఐ, 182 ఆర్థిక వ్యవస్థలను పరిగణించి లెక్కించింది. 2010 నాటి HDI లో ఈ సంఖ్య 169 దేశాలకు పడిపోయింది. [11] [12]
నోట్స్
[మార్చు]మూలాలు
[మార్చు]- ↑ "Human Development Index". Economic Times. Archived from the original on 1 December 2017. Retrieved 29 November 2017.
- ↑ "The Human Development concept". UNDP. 2010. Archived from the original on 15 April 2012. Retrieved 29 July 2011.
- ↑ Nations, United (2017). "What is Human Development". UNDP. Archived from the original on 27 October 2017. Retrieved 27 October 2017.
... human development approach, developed by the economist Mahbub Ul Haq ...'
- ↑ The Courier. Commission of the European Communities.
- ↑ Nations, United (4 November 2010). "Human Development Report 2010". UNDP. Archived from the original on 22 December 2015. Retrieved 15 December 2015.
- ↑ "Technical notes" (PDF). UNDP. 2013. Archived (PDF) from the original on 16 June 2015. Retrieved 15 December 2015.
- ↑ "New method of calculation of Human Development Index (HDI)". India Study Channel (in ఇంగ్లీష్). 1 June 2011. Archived from the original on 10 November 2017. Retrieved 19 November 2017.
- ↑ (ESYI is a calculation of the number of years a child is expected to attend school, or university, including the years spent on repetition. It is the sum of the age-specific enrollment ratios for primary, secondary, post-secondary non-tertiary and tertiary education and is calculated assuming the prevailing patterns of age-specific enrollment rates were to stay the same throughout the child's life. Expected years of schooling is capped at 18 years. (Source: UNESCO Institute for Statistics (2010). Correspondence on education indicators. March. Montreal.)
- ↑ 9.0 9.1 Human Development Report 2021-22: Uncertain Times, Unsettled Lives: Shaping our Future in a Transforming World (PDF). United Nations Development Programme. 8 September 2022. pp. 272–276. ISBN 978-9-211-26451-7. Retrieved 8 September 2022.
- ↑ Human Development Report 2021-22: Uncertain Times, Unsettled Lives: Shaping our Future in a Transforming World (PDF). United Nations Development Programme. 8 September 2022. pp. 277–280. ISBN 978-9-211-26451-7. Archived (PDF) from the original on 8 September 2022. Retrieved 8 September 2022.
{{cite book}}:|website=ignored (help) - ↑ Hastings, David A. (2009). "Filling Gaps in the Human Development Index". United Nations Economic and Social Commission for Asia and the Pacific, Working Paper WP/09/02. Archived from the original on 30 April 2011. Retrieved 1 December 2009.
- ↑ Hastings, David A. (2011). "A "Classic" Human Development Index with 232 Countries". HumanSecurityIndex.org. Archived from the original on 3 May 2011. Retrieved 9 March 2011. Information Note linked to data