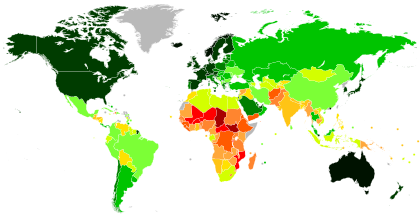
దేశాల జాబితా - మానవాభివృద్ధి సూచిక క్రమంలో

- చాలా ఎక్కువ (≥ 0.800)
- ఎక్కువ (0.700–0.799)
- మధ్యస్థం (0.550–0.699)
- తక్కువ (≤ 0.549)
- డేటా అందుబాటులో లేదు
- ≥ 0.950
- 0.900–0.950
- 0.850–0.899
- 0.800–0.849
- 0.750–0.799
- 0.700–0.749
- 0.650–0.699
- 0.600–0.649
- 0.550–0.599
- 0.500–0.549
- 0.450–0.499
- 0.400–0.449
- ≤ 0.399
- డేటా అందుబాటులో లేదు
ఐక్యరాజ్యసమితి అభివృద్ధి కార్యక్రమం (UNDP) వార్షిక మానవ అభివృద్ధి నివేదికలో 191 దేశాల మానవ అభివృద్ధి సూచిక (HDI)ను సంకలనం చేస్తుంది. మానవాభివృద్ధిని కొలవడానికి ఆయా దేశాల్లోని ఆరోగ్యం, విద్య, ఆదాయాలను ఈ సూచిక పరిగణిస్తుంది. దీన్ని వివిధ దేశాల మధ్య అభివృద్ధిలో పోలికకు, వివిధ కాలాల మధ్య దేశం సాధించిన పోలికకూ వాడవచ్చు. [1]
HDI అనేది మానవాభివృద్ధిని కొలిచేందుకు అత్యంత విస్తృతంగా ఉపయోగించే సూచిక. ఇది, ప్రజలు అభివృద్ధి భావనను చూసే విధానాన్ని మార్చింది. [2] [3] అయితే, సూచిక లోని పలు అంశాలు విమర్శలకు గురయ్యాయి. కొంతమంది విద్వాంసులు కారకాలను తూకం వేసే పద్ధతిని విమర్శించారు. ప్రత్యేకించి ఆయుర్దాయంలో ఒక్క సంవత్సరపు పెంపు వివిధ దేశాల మధ్య భిన్నంగా ఎలా అంచనా వేయబడుతుందనే విషయమై విమర్శలు వచ్చాయి. [3] [4] అలాగే, అది పరిగణలోకి తీసుకున్న పరిమితమైన అంశాలు, పంపిణీ లోనూ లింగం లోనూ ఉన్న అసమానత స్థాయిలను విస్మరించడం విమర్శలకు గురయ్యాయి. [5] [6] మొదటి దానికి ప్రతిస్పందనగా UNDP, తన 2010 నివేదికలో అసమానతను సర్దుబాటు చేసిన మానవ అభివృద్ధి సూచిక (IHDI)ని ప్రవేశపెట్టింది. రెండో దానికి ప్రతిస్పందనగా, 1995 నివేదికలో జెండర్ డెవలప్మెంట్ ఇండెక్స్ (GDI) ను ప్రవేశపెట్టింది. మరికొందరు, దేశానికి ఒక సంఖ్యను ఉపయోగించడం అనేది అతి సరళీకరణ అని విమర్శించారు. [7] [8] దేశాలలో అభివృద్ధి వ్యత్యాసాలను ప్రతిబింబించడానికి, నెదర్లాండ్స్లోని రాడ్బౌడ్ విశ్వవిద్యాలయంలో గ్లోబల్ డేటా ల్యాబ్ ద్వారా 1,600 కంటే ఎక్కువ ప్రాంతాలకు సంబంధించిన డేటా ఉన్న సబ్నేషనల్ HDI (SHDI) ని 2018లో ప్రవేశపెట్టారు. [8] 2020లో UNDP, గ్రహంపై ఒత్తిడి-సర్దుబాటు చేసిన మానవ అభివృద్ధి సూచిక (PHDI), అనే మరొక సూచికను ప్రవేశపెట్టింది. ఇది అధిక పర్యావరణ పాదముద్ర కలిగిన దేశాల స్కోర్లను తగ్గిస్తుంది.
కొలతలు, సూచికలు[మార్చు]
హెచ్డిఐని లెక్కించడానికి ఉపయోగించే డేటా చాలావరకు యునైటెడ్ నేషన్స్ ఎడ్యుకేషనల్, సైంటిఫిక్ అండ్ కల్చరల్ ఆర్గనైజేషన్ (యునెస్కో), యునైటెడ్ నేషన్స్ డిపార్ట్మెంట్ ఆఫ్ ఎకనామిక్ అండ్ సోషల్ అఫైర్స్, వరల్డ్ బ్యాంక్, ఇంటర్నేషనల్ మానిటరీ ఫండ్, ఆర్గనైజేషన్ ఫర్ ఎకనామిక్ కోఆపరేషన్ అండ్ డెవలప్మెంట్ (OECD) వంటి ఐక్యరాజ్యసమితి ఏజెన్సీలు, అంతర్జాతీయ సంస్థల నుండి వస్తుంది. అరుదుగా, సూచికలలో ఏదైనా ఒకటి లేనప్పుడు, క్రాస్-కంట్రీ రిగ్రెషన్ నమూనాలను ఉపయోగిస్తారు. డేటా లోను, మెథడాలజీ లోను మెరుగుదలలు జరుగుతున్న కారణంగా, వివిధ మానవ అభివృద్ధి నివేదికలలో ఇస్తున్న HDI విలువలు పోల్చదగినవి కావు. అందుచేత ప్రతి నివేదిక లోనూ మునుపటి కొన్ని సంవత్సరాల్లో లెక్కించిన HDIని తిరిగి లెక్కిస్తారు. [9] [10]
| కొలతలు | సూచికలు | డైమెన్షన్ ఇండెక్స్ | హెచ్.డి.ఐ |
|---|---|---|---|
| సుదీర్ఘమైన, ఆరోగ్యకరమైన జీవితం | పుట్టుక వద్ద ఆయుర్దాయం | జీవన కాలపు అంచనా సూచిక | మానవాభివృద్ధి సూచిక |
| జ్ఞానం |
|
విద్యా సూచిక | |
| సరైన జీవన ప్రమాణం | తలసరి GNI (PPP $) | GNI సూచిక |

హ్యూమన్ డెవలప్మెంట్ రిపోర్ట్లో మొత్తం 193 ఐక్యరాజ్యసమితి సభ్యదేశాలు, అలాగే పాలస్తీనా రాజ్యం, హాంకాంగ్ SAR లు ఉన్నాయి. అయితే మానవ అభివృద్ధి సూచిక 4 UN సభ్య దేశాలకు లెక్కించలేదు. అవి DPR కొరియా (ఉత్తర కొరియా), మొనాకో, నౌరు, సోమాలియా. అయితే ఈ దేశాల కోసం ఇండెక్స్లోని కొన్ని భాగాలను లెక్కించవచ్చు. మొత్తంగా, 191 దేశాలకు HDI అందుబాటులో ఉంది. [12]
గ్లోబల్ డేటా ల్యాబ్, సోమాలియా హెచ్డిఐపై కూడా డేటాను అందిస్తుంది. 2019 లో ఇది 0.361 వద్ద ఉంది. ఇది ప్రపంచంలోనే అత్యల్పమైనది. అయితే సిరియా డేటా అందుబాటులో లేదు. [13]
2021 సంవత్సరంలో 1 నుండి 66 ర్యాంకుల వరకు ఉన్న దేశాలను చాలా ఎక్కువ HDI ఉన్న దేశాలుగా పరిగణించారు. 67 నుండి 115 ర్యాంక్లు ఎక్కువ HDI గాను, 116 నుండి 159 ర్యాంక్ మధ్యస్థ HDIగాను, 160 నుండి 191 ర్యాంక్లను తక్కువ HDI దేశాలు గానూ పరిగణించారు. [14] [9]
| ర్యాంకు | దేశం | హెచ్.డి.ఐ | ||
|---|---|---|---|---|
| 2021 డేటా (2022 నివేదిక) | 2015 నుండి మార్పు | 2021 డేటా (2022 నివేదిక)[15] | సగటు వార్షిక వృద్ధి (2010–2021)[16] | |
| 1 | 0.962 | |||
| 2 | 0.961 | |||
| 3 | 0.959 | |||
| 4 | 0.952 | |||
| 5 | 0.951 | |||
| 6 | 0.948 | |||
| 7 | 0.947 | |||
| 8 | 0.945 | |||
| 9 | 0.942 | |||
| 10 | 0.941 | |||
| 11 | 0.940 | |||
| 12 | 0.939 | |||
| 13 | 0.937 | |||
| 14 | ||||
| 15 | 0.936 | |||
| 16 | 0.935 | |||
| 17 | 0.930 | |||
| 18 | 0.929 | |||
| 19 | 0.925 | |||
| 21 | 0.921 | |||
| 22 | 0.919 | |||
| 23 | 0.918 | |||
| 25 | 0.916 | |||
| 26 | 0.911 | |||
| 27 | 0.905 | |||
| 28 | 0.903 | |||
| 29 | 0.896 | |||
| 30 | 0.895 | |||
| 31 | 0.890 | |||
| 32 | మూస:Country data Czechia | 0.889 | ||
| 33 | 0.887 | |||
| 34 | 0.876 | |||
| 35 | 0.875 | |||
| 36 | ||||
| 37 | ||||
| 38 | 0.866 | |||
| 39 | 0.863 | |||
| 40 | 0.858 | |||
| 42 | 0.855 | |||
| 43 | ||||
| 44 | NA[a] | 0.853 | NA | |
| 45 | 0.848 | |||
| 46 | 0.846 | |||
| 47 | 0.842 | |||
| 48 | 0.838 | |||
| 49 | 0.832 | |||
| 50 | 0.831 | |||
| 51 | 0.829 | |||
| 52 | 0.822 | |||
| 53 | 0.821 | |||
| 54 | 0.816 | |||
| 55 | 0.812 | |||
| 56 | 0.811 | |||
| 57 | 0.810 | |||
| 58 | 0.809 | |||
| 59 | ||||
| 60 | 0.808 | |||
| 61 | 0.805 | |||
| 62 | 0.803 | |||
| 63 | 0.802 | |||
| 64 | ||||
| 65 | ||||
| 66 | 0.800 | |||
| 67 | 0.796 | |||
| 68 | 0.795 | |||
| 69 | 0.795 | |||
| 70 | 0.790 | |||
| 71 | 0.788 | |||
| 72 | 0.785 | |||
| 73 | 0.782 | |||
| 74 | 0.780 | |||
| 75 | 0.777 | |||
| 76 | 0.774 | |||
| 77 | 0.773 | |||
| 78 | 0.770 | |||
| 79 | 0.768 | |||
| 80 | 0.767 | |||
| 81 | ||||
| 82 | ||||
| 83 | 0.764 | |||
| 84 | 0.762 | |||
| 85 | 0.759 | |||
| 86 | 0.758 | |||
| 87 | 0.754 | |||
| 88 | 0.752 | |||
| 89 | 0.751 | |||
| 90 | 0.747 | |||
| 91 | 0.745 | |||
| 92 | ||||
| 93 | ||||
| 94 | ||||
| 95 | 0.740 | |||
| 96 | 0.739 | |||
| 97 | 0.731 | |||
| 98 | ||||
| 99 | 0.730 | |||
| 100 | ||||
| 101 | 0.727 | |||
| 102 | 0.720 | |||
| 102 | ||||
| 104 | 0.718 | |||
| 105 | 0.717 | |||
| 106 | 0.715 | |||
| 108 | 0.714 | |||
| 109 | 0.713 | |||
| 110 | 0.709 | |||
| 111 | 0.707 | |||
| 112 | 0.706 | |||
| 114 | 0.705 | |||
| 115 | 0.703 | |||
| 116 | 0.699 | |||
| 117 | 0.693 | |||
| 118 | 0.692 | |||
| 119 | ||||
| 120 | 0.691 | |||
| 121 | 0.686 | |||
| 122 | 0.685 | |||
| 123 | 0.683 | |||
| 124 | ||||
| 125 | 0.675 | |||
| 126 | 0.667 | |||
| 127 | 0.666 | |||
| 128 | 0.662 | |||
| 129 | 0.661 | |||
| 130 | 0.641 | |||
| 131 | 0.639 | NA | ||
| 132 | 0.633 | |||
| 133 | 0.632 | |||
| 134 | 0.628 | |||
| 135 | 0.627 | |||
| 136 | 0.624 | |||
| 137 | 0.621 | |||
| 138 | 0.618 | |||
| 139 | 0.615 | |||
| 140 | 0.607 | |||
| 141 | ||||
| 142 | ||||
| 143 | 0.602 | |||
| 144 | 0.597 | |||
| 145 | 0.596 | |||
| 146 | 0.593 | |||
| 147 | ||||
| 148 | 0.586 | |||
| 149 | 0.585 | |||
| 150 | 0.577 | |||
| 151 | 0.576 | |||
| 152 | 0.575 | |||
| 153 | 0.571 | |||
| 154 | 0.565 | |||
| 155 | 0.564 | |||
| 156 | 0.558 | |||
| 157 | ||||
| 158 | 0.556 | |||
| 159 | 0.550 | |||
| 160 | 0.549 | |||
| 161 | 0.544 | |||
| 162 | 0.539 | |||
| 163 | 0.535 | |||
| 164 | ||||
| 165 | 0.534 | |||
| 166 | 0.525 | |||
| 167 | ||||
| 168 | 0.514 | |||
| 169 | 0.512 | |||
| 170 | 0.511 | |||
| 171 | 0.509 | |||
| 172 | 0.508 | |||
| 173 | 0.501 | |||
| 174 | 0.500 | |||
| 175 | 0.498 | |||
| 176 | 0.492 | |||
| 177 | 0.483 | |||
| 178 | 0.481 | |||
| 179 | 0.479 | |||
| 180 | 0.478 | |||
| 181 | 0.477 | |||
| 182 | 0.465 | |||
| 183 | 0.455 | |||
| 184 | 0.449 | |||
| 185 | 0.446 | |||
| 186 | 0.428 | |||
| 187 | 0.426 | |||
| 188 | 0.404 | |||
| 189 | 0.400 | |||
| 190 | 0.394 | |||
| 191 | 0.385 | |||
ప్రాంతాలు, సమూహాలు[మార్చు]
మానవాభివృద్ధి నివేదిక వివిధ దేశాల సమూహాలకు కూడా హెచ్డిఐని లెక్కించింది. వీటిలో UNDP ప్రాంతీయ వర్గీకరణల ఆధారంగా ప్రాంతీయ సమూహాలు, [17] HDI సమూహాల్లో వివిధ HDI బ్రాకెట్లలో ఉన్న దేశాలు, OECD సభ్యులు, అనేక ఇతర UN సమూహాలూ ఉన్నాయి. [18] సమూహంలో డేటా అందుబాటులో ఉన్న దేశాలకు విడివిడిగా ఎలా లెక్కిస్తారో అదే విధంగా సమూహ HDI విలువలను కూడా లెక్కిస్తారు. [19]
| Region or group | 1990 | 2000 | 2010 | 2015 | 2018 | 2019 | 2020 | 2021 |
|---|---|---|---|---|---|---|---|---|
| OECD | 0.795 | 0.840 | 0.875 | 0.893 | 0.901 | 0.905 | 0.897 | 0.899 |
| చాలా ఎక్కువ మానవాభివృద్ధి | 0.784 | 0.826 | 0.868 | 0.889 | 0.898 | 0.902 | 0.895 | 0.896 |
| ఐరోపా,మధ్య ఆసియా | 0.664 | 0.681 | 0.746 | 0.783 | 0.798 | 0.802 | 0.793 | 0.796 |
| లాటిన్ అమెరికా, కరిబియన్ | 0.633 | 0.689 | 0.733 | 0.758 | 0.766 | 0.768 | 0.755 | 0.754 |
| ఎక్కువ మానవాభివృద్ధి | 0.557 | 0.625 | 0.700 | 0.734 | 0.751 | 0.756 | 0.753 | 0.754 |
| తూర్పు ఆసియా, పసిఫిక్ | 0.507 | 0.592 | 0.684 | 0.722 | 0.741 | 0.748 | 0.748 | 0.749 |
| World | 0.601 | 0.645 | 0.697 | 0.724 | 0.736 | 0.739 | 0.735 | 0.732 |
| అభివృద్ధి చెందుతున్న చిన్న ద్వీపదేశాలు | 0.601 | 0.649 | 0.693 | 0.723 | 0.734 | 0.738 | 0.732 | 0.730 |
| అరబ్బు దేశాలు | 0.555 | 0.618 | 0.676 | 0.697 | 0.711 | 0.715 | 0.708 | 0.708 |
| అభివృద్ధి చెందుతున్న దేశాలు | 0.513 | 0.569 | 0.638 | 0.673 | 0.687 | 0.691 | 0.687 | 0.685 |
| మధ్యస్థ మానవాభివృద్ధి | 0.453 | 0.506 | 0.582 | 0.627 | 0.643 | 0.645 | 0.642 | 0.636 |
| దక్షిణాసియా | 0.442 | 0.500 | 0.576 | 0.623 | 0.640 | 0.641 | 0.638 | 0.632 |
| సహారా-దిగువ ఆఫ్రికా | 0.407 | 0.430 | 0.503 | 0.534 | 0.547 | 0.552 | 0.549 | 0.547 |
| అల్ప అభివృద్ధి దేశాలు | 0.357 | 0.408 | 0.487 | 0.520 | 0.537 | 0.542 | 0.542 | 0.540 |
| తక్కువ మానవాభివృద్ధి | 0.356 | 0.399 | 0.477 | 0.506 | 0.518 | 0.522 | 0.519 | 0.518 |
నోట్స్[మార్చు]
- ↑ HDI not available before 2018 in latest report
మూలాలు[మార్చు]
- ↑ "Human Development Index (HDI) | Human Development Reports". hdr.undp.org. United Nations Development Programme. Archived from the original on 28 January 2017. Retrieved 15 December 2020.
- ↑ (February 1999). "An Assessment of the Measurement Properties of the Human Development Index".
- ↑ 3.0 3.1 Sanderson, Warren; Scherbov, Sergei; Simone, Ghislandi (November 8, 2018). "The best country to live in might not be Norway after all". Quartz (in ఇంగ్లీష్). Archived from the original on 23 January 2021. Retrieved 6 June 2021.
- ↑ (2012-11-01). "Troubling tradeoffs in the Human Development Index".
- ↑ (1997-08-01). "The inequality-adjusted human development index: A constructive proposal".
- ↑ (1997-02-01). "Making the Human Development Index (HDI) gender-sensitive".
- ↑ (1998). "The Mismeasure of Nations: A Review Essay".
- ↑ 8.0 8.1 Iñaki, Permanyer; Jeroen, Smits (31 May 2018). "The Subnational Human Development Index: Moving beyond country-level averages". United Nations Development Programme. Archived from the original on 6 June 2021. Retrieved 15 December 2020.
- ↑ 9.0 9.1 "Human Development Report 2019 – Technical notes" (PDF). hdr.undp.org. United Nations Development Programme. pp. 2–4. Archived (PDF) from the original on 6 June 2021. Retrieved 15 December 2020.
- ↑ "Human Development Report 2020: Reader's Guide". hdr.undp.org. United Nations Development Programme. Archived from the original on 16 April 2021. Retrieved 15 December 2020.
- ↑ "Human Development Index (HDI)". UNDP.
- ↑ Human Development Report 2021-22: Uncertain Times, Unsettled Lives: Shaping our Future in a Transforming World (PDF). United Nations Development Programme. 8 September 2022. pp. 272–276. ISBN 978-9-211-26451-7. Retrieved 8 September 2022.
- ↑ "Subnational Human Development Index (SHDI) Area Database - Somalia". Global Data Lab. Archived from the original on 8 సెప్టెంబరు 2022. Retrieved 8 September 2022.
- ↑ "Archived copy" (PDF). Archived (PDF) from the original on 15 December 2020. Retrieved 15 December 2020.
{{cite web}}: CS1 maint: archived copy as title (link) - ↑ Human Development Report 2021-22: Uncertain Times, Unsettled Lives: Shaping our Future in a Transforming World (PDF). United Nations Development Programme. 8 September 2022. pp. 272–276. ISBN 978-9-211-26451-7. Retrieved 8 September 2022.
- ↑ Human Development Report 2021-22: Uncertain Times, Unsettled Lives: Shaping our Future in a Transforming World (PDF). United Nations Development Programme. 8 September 2022. pp. 277–280. ISBN 978-9-211-26451-7. Archived (PDF) from the original on 8 September 2022. Retrieved 8 September 2022.
{{cite book}}:|website=ignored (help) - ↑ "Developing regions | Human Development Reports". hdr.undp.org. United Nations Development Programme. Archived from the original on 6 June 2021. Retrieved 30 March 2021.
- ↑ "Human Development Report 2020: Reader's Guide | Human Development Reports". hdr.undp.org. United Nations Development Programme. Archived from the original on 16 April 2021. Retrieved 30 March 2021.
- ↑ "Human Development Report 2020 – Technical notes" (PDF). hdr.undp.org. United Nations Development Programme. p. 4. Archived (PDF) from the original on 6 June 2021. Retrieved 30 March 2021.